Average credit card debt: It’s bigger than you think

Credit card debt is a personal thing. It causes tensions within families, and limits how people can spend their time and money.
Statistics can’t capture the human impact of credit card debt, but it is important that statistics represent as closely as possible how the burden of credit card debt weighs upon family finances. For this reason, IndexCreditCards.com is now taking a new approach to calculating average credit card debt.
We used the latest available data from the Federal Reserve and the US Census Bureau to calculate a more accurate picture of credit card debt for households who carry credit card debt. We also ran calculations for a series of dates going back to the start of the Great Recession, in order to reveal trends in credit card debt over the years.
The old method underestimated the debt
One way to estimate the average amount of credit card debt per U.S. family is to divide the total amount of credit card debt outstanding, according to the Federal Reserve, by the number of adults and the number of households in the U.S., according to the U.S. census.
Our February 2010 average credit card debt analysis did just that, finding that the average revolving debt (which mainly consists of credit card debt) was $3,752 for each adult, $7,394 for each household. With updated numbers, this method comes up with an average credit card debt of $3,415 per adult and $6,991 per household at the end of 2011.
So it appears that U.S. average credit card debt is headed down. That’s undoubtedly a good thing. But does it tell the whole story?
Who really shoulders the burden
The above calculation doesn’t take into account that not all families have credit cards. The Federal Reserve’s Survey of Consumer Finances, a study which is released every three years, tells us that only 73 percent of households have credit cards. Households without credit cards don’t have any credit card debt. Taking that into account, the households with credit cards would carry an average credit card debt of $9,577 per household, not $6,991.
But wait! Some of those households pay off their credit cards each month, and so they don’t carry credit card debt either. The SCF goes on to say that only 46.1 percent of households actually carry debt. So to really get an idea of what’s going on, we need to distribute the total credit card debt among just the households that owe this debt, then the average debt burden jumps to $15,166 per household.
Not $6,991, not $9,577, but $15,166, is what it’s really like for the average family who has credit card debt these days.
The good news
As daunting as that debt burden is, it has improved a bit since the start of the last recession. As of December 31, 2007, the average credit card debt burden for each family carrying credit card debt was $18,180. It peaked at $18,596 in mid-2008. By the middle of 2011, it had dipped to $15,069 as shown on this chart:

But all is not rosy in 2012. While the current figure of $15,166 is still an improvement from what we saw in the depths of the recession, we can see that the typical credit card debt burden has started to creep back up again. This will be an important trend to watch in the months ahead. The central question is, can the economy sustain a recovery without building up another credit card debt bubble?
Low-income families carry the heaviest share
Whether or not that $15,166 in credit card debt represents a problem for an American family depends a great deal on that family’s income. Credit card debt is not evenly distributed across all income tiers, of course, since people who earn more are likely to owe more. But what really matters is how large that debt is relative to household income. Unfortunately, it is the poorest families who typically end up with debt that is out of proportion with their incomes.
Some insight into the distribution of credit card debt across different income tiers can be found in the Survey of Consumer Finances mentioned earlier. Unfortunately, a significant flaw of the SCF is that it is based on figures reported by consumers themselves. The Fed has found that consumers routinely, and perhaps unknowingly, under-report their debt levels.
Compensating for under-reporting of debt
One way around this is to adjust the credit card debt figures from the SCF so they match the total amount of revolving debt reported monthly to the Fed by credit card companies. This also allows the analysis to be updated more frequently than the three-year cycle of the SCF.
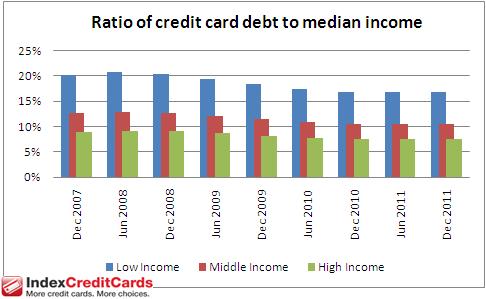
Using this approach, IndexCreditCards found that households in the lowest income bracket had the highest ratio of credit card debt to income. As of the end of 2011, their median credit card debt outstanding represented 16.9 percent of household income. The level of credit card debt as a percentage of income goes down steadily as income levels rise, even though the dollar amount of debt increases. For families with incomes in the top 10 percent, the typical credit card debt represents just 7.5 percent of household income.
The median credit card debt burden for different income levels as of Dec. 31, 2011, is shown in this table:
| Income percentile | Median credit card debt | Credit card debt as % of income |
| 1 – 19.9 | $2,077 | 16.9% |
| 20 – 39.9 | $3,739 | 13.0% |
| 40 – 59.9 | $4,986 | 10.5% |
| 60 – 79.9 | $8,310 | 11.1% |
| 80 – 89.9 | $11,426 | 10.0% |
| 90 – 100 | $15,581 | 7.5% |
Since 2008, the debt to income ratio has been trending downward, although it is consistently greater for lower income brackets, as shown in this chart below. (Low income is the 1-19.9 percentile, middle income is the 40-59.9 percentile and high income is the 90-100 percentile.)
The silver lining
The good news is that families with the highest credit card debt as percent of income have seen the most improvement in the last couple of years. The current 16.9 percent credit card debt burden among low income households is down from a peak of 20.7 percent that was reached in mid-2008. While this represents an improvement of 3.8 percentage points in debt burden, at the top income tier the improvement over the same time period was just 1.5 percentage points.
Overall, the problem of credit card debt has diminished, but not gone away, since the Great Recession. Refining and improving the methods of quantifying that debt can help us understand and ultimately solve the problem.
Disclaimer:The information in this article is believed to be accurate as of the date it was written. Please keep in mind that credit card offers change frequently. Therefore, we cannot guarantee the accuracy of the information in this article. Reasonable efforts are made to maintain accurate information. See the online credit card application for full terms and conditions on offers and rewards. Please verify all terms and conditions of any credit card prior to applying.
This content is not provided by any company mentioned in this article. Any opinions, analyses, reviews or recommendations expressed here are those of the author’s alone, and have not been reviewed, approved or otherwise endorsed by any such company. CardRatings.com does not review every company or every offer available on the market.
Published (Modified )